Hedonic analysis considering market segmentation
Hedonic analysis is one of the most widely adopted methods in housing market analysis. Hedonic analysis is based on economic theory and explains land and rent prices based on characteristics such as a building’s floor area and number of floors. This is called a regression model. By using a regression model, factors that affect pricing can be analyzed. However, applying such theoretical models can be difficult because the theoretical assumptions of market conditions and data obtained from the actual market don’t always coincide. For example, most people don’t have access to information such as the personal attributes of tenants, so a model would have to assume this to reflect evaluations made in the real world. Also, properties are considered to be strongly tied to its local market, because the location of a house is fixed.
Due to such information asymmetry and the effect of local market conditions, the correspondence between the price of a property and its observed characteristics may not correspond to each other. For example, let’s say that you only have data on the price and floor area of a certain group of properties. In this case, properties with the same floor area may appear to have exactly the same conditions in the data, but, in reality, their prices may vastly differ depending on their location and other attributes such as its appliances. Moreover, it would be difficult to estimate a regression model in this case.
In applying hedonic analysis, a simple model called a linear regression model is often used first. If such a simple model does not provide sufficient explanatory power, a more flexible nonlinear model may be applied. However, applying a nonlinear model in a situation in which there is nor correspondence ( in this case, between prices and floor area), there is a risk that it appears as if there is a single correlation or relationship between two factors.
In our research, we pointed out that the market segmentation method is an effective solution to this problem. The market segmentation method involves dividing a dataset into several categories (for example, by elementary school districts) and applying a regression model to each of them. In many cases, a linear regression model is used.
If properties with the same price per floor area can be grouped and divided effectively, the relationship between price and floor area may be explained adequately by applying the market segmentation method. Another advantage of the market segmentation method is that each of the individual regression models are very simple, making it easier to interpret the results of analysis compared to nonlinear models. However, there is currently no academic consensus on how to divide the model and how many parts to divide it into.
For this reason, we have proposed a new automatic market segmentation method. In this method, properties are grouped based on the two criteria below.
- Similarity of property characteristics
- Correspondence in the strength of the relationship between property prices and characteristics is the same
If the floor area is to be considered a key characteristic of a property, properties that “have similar floor area” and “have similar price per floor area,” they can be grouped into one segment. In previous research, several methods that satisfy one of these two criteria have been proposed. Our method integrates these two and also incorporates a function that automatically adjusts the number of groups by pruning off groups that are too small to fit the data.
We applied this proposed method to the data on rent in Setagaya Ward and found that we could group properties nearby the train lines. It also performed well as a price prediction model. We also found differences in the relationship between house characteristics and prices for each group, and believe that the results of this research will lead to further breakthroughs in understanding the housing market.
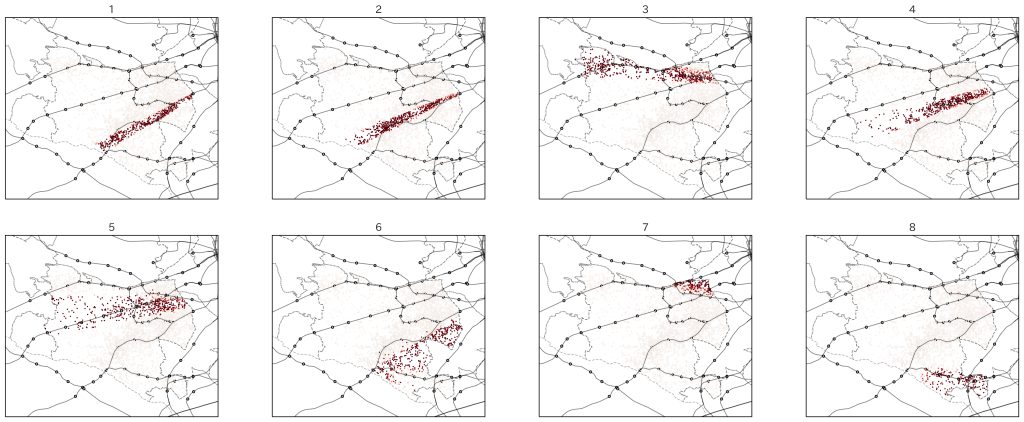
Map showing the result of grouping rental properties in Setagaya Ward. There were 8 groups. The color intensity of the dots indicates the posterior probability of a property belonging to the group in question. Solid lines indicate railroad lines and dashed lines indicate ward boundaries. Circles marked on solid lines indicate train stations.
Below are the 8 groups:
- Properties along the Denentoshi Line (1)
- Properties along the Denentoshi Line (2)
- Properties along the Keio and Inokashira Lines
- Properties in between Denentoshi Line and Odawara Line
- Properties along the Odawara Line
- Properties in the area southeast on the Denentoshi Line
- Properties in the area surrounded by the Keio, Inokashira, and Odawara lines (near (Shimokitazawa and Meidaimae stations)
- Properties near the Jiyugaoka area
Properties in Group 1 tended to have smaller occupied, non-shared areas than those in Group 2.